The three numbers, in one line each
Hotel reports are full of short names, but three of them carry most of the meaning. Here they are side by side, with the worked example used through the rest of this guide: a 40-room hotel over one week.
| Number | What it tells you | How to work it out | Example |
|---|---|---|---|
| Occupancy | How full the hotel was | Room nights sold ÷ room nights available | 210 ÷ 280 = 75% |
| ADR (average daily rate) | What each sold room earned, on average | Room revenue ÷ room nights sold | $21,000 ÷ 210 = $100 |
| RevPAR (revenue per available room) | What every room earned, sold or not | Room revenue ÷ room nights available | $21,000 ÷ 280 = $75 |
A room night is one room sold for one night. A guest staying three nights in one room is three room nights; a family taking two rooms for two nights is four. Every figure here is built on that unit, so it is worth getting right.
Occupancy: how full you were
Occupancy is the share of your rooms that were sold. For a single night it is rooms sold divided by rooms you have. For a week or a month, use room nights: the number of rooms multiplied by the number of nights gives the room nights available, and the room nights you sold divided by that is the occupancy.
Worked example: the hotel has 40 rooms, so a week has 40 × 7 = 280 room nights available. It sold 210 of them. Occupancy is 210 ÷ 280 = 75%.
Two decisions change the figure, so make them once and keep to them:
- Rooms out of order. Some hotels leave them out of the rooms available, so a room being repaired doesn’t pull occupancy down. Others keep them in, so the cost of a room off sale shows. Either is fine; switching between them from week to week is not.
- Free rooms. Complimentary and House Use nights fill a room but earn nothing. Many hotels count them separately, so a month of free nights doesn’t make occupancy look better than sales were.
ADR: what each sold room earned
Average daily rate, often shortened to ADR or just average rate, is the room revenue divided by the room nights sold. It answers the question “when we sold a room, what did we get for it?”
Worked example: the 210 room nights earned $21,000 in room revenue. ADR is $21,000 ÷ 210 = $100.
Use room revenue only: the room nights on each guest’s folio, after discounts, before tax. Leave out the restaurant, laundry and any other charges, even when a guest’s whole bill was paid together. If breakfast is included in a rate, decide whether you take its value out of room revenue, and do the same every week.
RevPAR: the number that keeps both honest
Revenue per available room is the room revenue divided by every room night you had available, sold or not. You can also get it by multiplying the other two: occupancy × ADR.
Worked example: $21,000 ÷ 280 = $75. Or 75% × $100 = $75. The same answer either way.
RevPAR matters because each of the other two can look good while the hotel does worse. Fill every room by cutting prices, and occupancy rises while each room earns less. Raise prices and lose guests, and ADR rises while rooms sit empty. RevPAR moves with both, so it only rises when the rooms are really earning more.
| Occupancy | ADR | RevPAR | |
|---|---|---|---|
| Week A: priced low, nearly full | 90% | $80 | $72 |
| Week B: priced high, quieter | 60% | $120 | $72 |
The rooms earned the same in both weeks, but the weeks were not the same. Week A had half again as many guests: more cleaning, more laundry, more breakfasts, more wear. Week B earned the same with fewer guests, so it probably made more profit. That is why RevPAR is the figure to compare week to week, and why profit needs a number of its own (more on GOPPAR below).
When a number drops: the one question to ask
A falling number is a reason to look, not a verdict. The quickest way to find the cause is to ask one question for each figure, then open the report that answers it.
| If this drops | Ask | Where to look |
|---|---|---|
| Occupancy | Which nights went quiet, and which booking sources brought fewer guests? | Room nights by day, and bookings by source |
| ADR | Which rates sold, and who gave discounts? | Room revenue by rate, and discounts by person |
| RevPAR | Was it fewer rooms, or cheaper rooms? | Occupancy and ADR side by side |
| GOPPAR | Which cost grew faster than revenue? | Profit and loss against the month before |
| Spend per cover | What did each table stop ordering? | Restaurant sales by dish and category |
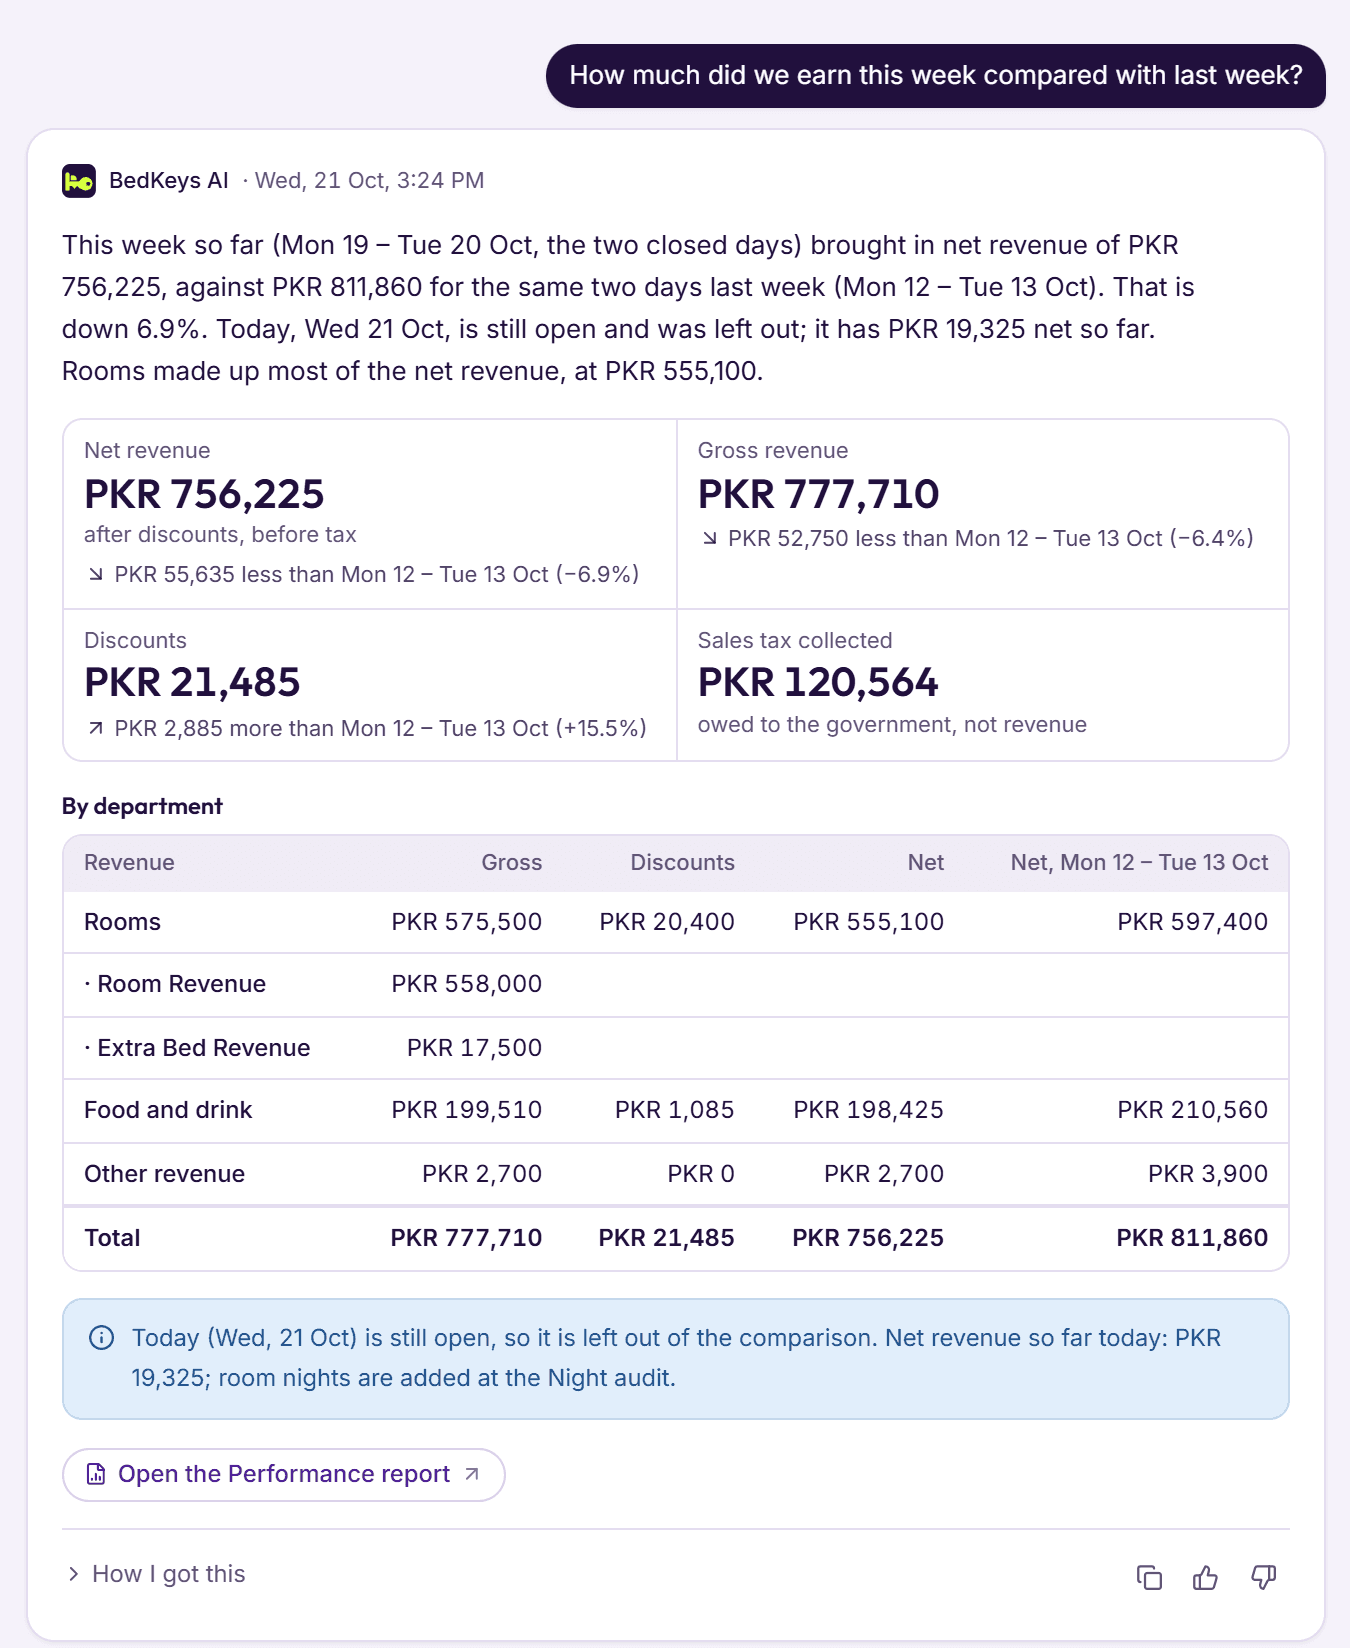
Example: last week the hotel ran at 75% occupancy with an ADR of $100, a RevPAR of $75. This week occupancy rose to 85%, which looks like good news, but ADR fell to $80. RevPAR is now 85% × $80 = $68, about 9% lower. The question “fewer rooms or cheaper rooms?” has a clear answer: cheaper rooms. The next step is to look at which rates sold and who gave discounts, not at the booking sites. Our discount policy guide covers how to set limits so this doesn’t happen by accident.
Always compare like with like. A week with a public holiday, a big local event or a wedding group isn’t a fair comparison with an ordinary one. Put each week next to the same week before and, once you have a year of figures, the same week last year.
GOPPAR: when profit matters more than revenue
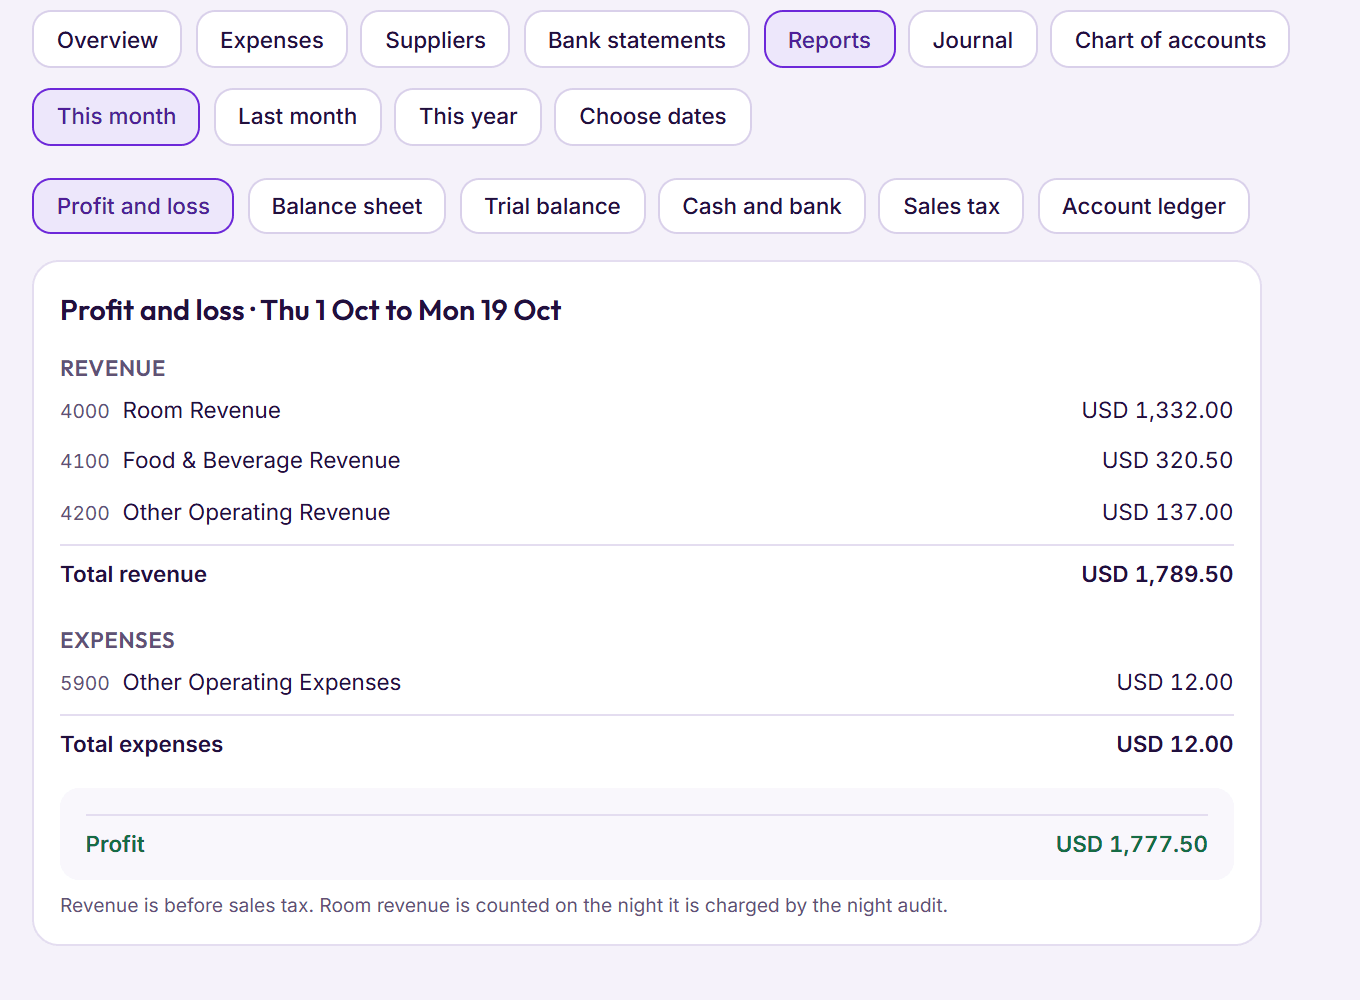
RevPAR only counts room revenue, and says nothing about what it cost to earn it. GOPPAR, gross operating profit per available room, fills that gap. Take everything the hotel earned (rooms, restaurant, other services), subtract the costs of running it (staff, food and drink, laundry, utilities, booking-site commissions, supplies), and divide what is left by the room nights available.
Worked example: over a 30-day month, the 40-room hotel has 1,200 room nights available. It earned $90,000 from rooms and $30,000 from the restaurant, $120,000 in all. Running costs came to $78,000, leaving a gross operating profit of $42,000. GOPPAR is $42,000 ÷ 1,200 = $35. RevPAR for the same month is $90,000 ÷ 1,200 = $75.
Gross operating profit is before rent, loan repayments, depreciation and the owner’s own taxes, so it measures how well the hotel is run rather than how it is financed. Read it monthly: weekly costs are too lumpy to compare. If RevPAR holds steady and GOPPAR falls, revenue isn’t the problem; one of the costs is.
The restaurant’s figures, briefly
If the hotel has a restaurant or bar, two more numbers belong in the weekly read.
- Spend per cover. A cover is one guest served. Food and drink sales divided by covers gives the average each guest spent. A month with 1,500 covers and $30,000 of sales is $20 a cover. If covers hold and spend per cover falls, guests are ordering less or cheaper, which is a menu and service question.
- Food cost. The cost of ingredients used, divided by food sales. $9,000 of ingredients against $30,000 of sales is 30%. A food cost that creeps up while prices stay the same usually means waste, portions growing, or stock leaving without a sale.
Keep complimentary meals and staff meals out of covers and sales, and count them separately. Our hotel restaurant guide explains how recipes and stock counts keep the food cost honest.
A ten-minute weekly read
These numbers are only as good as the closed days behind them. If the Night audit is skipped, room nights aren’t posted and the week’s figures are wrong before you read them. Our guide to what a hotel PMS does explains how the reports are built from each day’s close.
Every week, on the same day
- Every day of the week was closed by the Night audit.
- Occupancy, ADR and RevPAR are next to last week’s, and the same week last year if you have it.
- If RevPAR fell, you know whether it was fewer rooms or cheaper rooms.
- Room nights by booking source show where guests came from, and which sources grew or shrank.
- Discounts and free rooms for the week are in line with what you expected.
- In the restaurant, covers, spend per cover and the best-selling dishes look normal.
- Once a month: profit and loss against the month before, and GOPPAR worked out from it.